
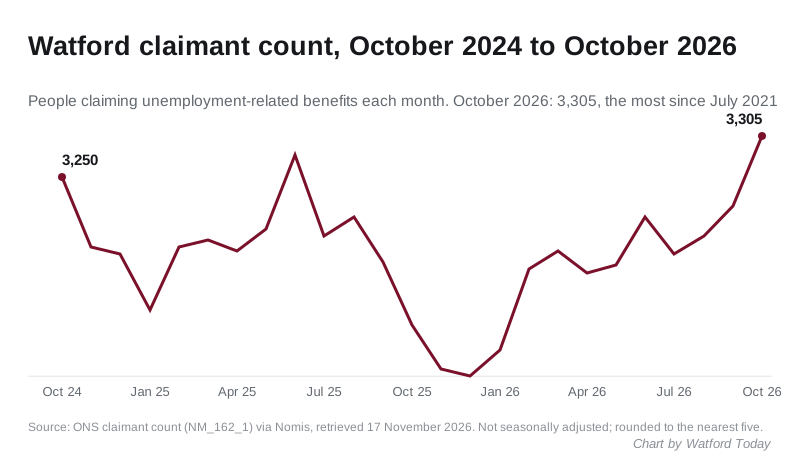
Watford had 3,305 benefit claimants in October, the most since July 2021. The 8.4% rise in a year is the fastest of Hertfordshire's ten districts.
3,305 people in Watford were claiming unemployment-related benefits in October 2026. That is the highest monthly count since July 2021, when the borough was still coming out of the pandemic.
The count rose by 255 in a year, or 8.4 per cent. No other district in Hertfordshire grew as fast. The county as a whole rose 4.4 per cent.
The figures are from the Office for National Statistics claimant count for October, published through Nomis on 17 November.
The headline figures
- 3,305 claimants, 4.7 per cent of residents aged 16 to 64.
- Up 95 on September, when the count was 3,210.
- Up 255 on October 2025, when it was 3,050.
The rise between September and October goes against the recent pattern. In both of the last two years the count fell between those months: by 5 in 2024 and by 85 in 2025.
Every age group is up, the over-50s most
| Group | October 2025 | October 2026 | Change |
|---|---|---|---|
| Aged 16 to 24 | 435 | 485 | +50 (+11.5%) |
| Aged 25 to 49 | 1,910 | 2,020 | +110 (+5.8%) |
| Aged 50 and over | 700 | 800 | +100 (+14.3%) |
| Men | 1,590 | 1,710 | +120 (+7.5%) |
| Women | 1,460 | 1,595 | +135 (+9.2%) |
The over-50s grew fastest. There are now 800 claimants aged 50 and over in Watford, level with July 2021 and more than in any month since.
That rise is steeper than elsewhere. Claimants aged 50 and over went up 8.8 per cent across Hertfordshire in the same year, and 6.7 per cent across Great Britain. In Watford the rise was 14.3 per cent.
Women again account for slightly more of the growth than men, as they did in our August report.
The fastest rise in Hertfordshire
| Area | Claimants | Rate | Change on October 2025 |
|---|---|---|---|
| Watford | 3,305 | 4.7% | +255 (+8.4%) |
| Hertsmere | 2,475 | 3.6% | +110 (+4.7%) |
| Stevenage | 2,065 | 3.5% | +85 (+4.3%) |
| Broxbourne | 2,175 | 3.4% | +40 (+1.9%) |
| Dacorum | 3,180 | 3.2% | no change |
| Welwyn Hatfield | 2,550 | 3.2% | +135 (+5.6%) |
| Three Rivers | 1,655 | 2.8% | +75 (+4.7%) |
| St Albans | 2,280 | 2.5% | +70 (+3.2%) |
| North Hertfordshire | 2,005 | 2.4% | +120 (+6.4%) |
| East Hertfordshire | 1,935 | 2.0% | +105 (+5.7%) |
| Hertfordshire | 23,620 | 3.0% | +990 (+4.4%) |
| East of England | 132,830 | 3.3% | +5,810 (+4.6%) |
| Great Britain | 1,672,285 | 4.0% | +59,490 (+3.7%) |
That reverses what the figures showed in August. Then, Watford’s count was growing more slowly than the county’s. Now it is growing almost twice as fast.
- Watford’s rate of 4.7 per cent is the highest in Hertfordshire. Hertsmere is next on 3.6 per cent.
- It is also above the Great Britain rate of 4.0 per cent.
- Watford added 255 claimants in a year, a quarter of the county’s total rise of 990.
Where in Watford
| Ward | Claimants | Rate |
|---|---|---|
| Holywell | 460 | 6.2% |
| Central | 530 | 6.1% |
| Leggatts | 305 | 5.4% |
| Meriden | 270 | 5.4% |
| Vicarage | 370 | 5.3% |
| Callowland | 310 | 4.7% |
| Woodside | 230 | 4.6% |
| Tudor | 190 | 4.2% |
| Stanborough | 175 | 3.7% |
| Oxhey | 155 | 3.3% |
| Nascot | 160 | 2.8% |
| Park | 145 | 2.6% |
Holywell still has the highest rate, 6.2 per cent. Central has the most claimants, 530. Park has the lowest rate, 2.6 per cent. The ward figures add up to 3,300 against a borough total of 3,305, because every figure is rounded to the nearest five.
August’s figure has been revised down
We reported August on its first release as 3,235 claimants. ONS has since revised August to 3,170. The comparisons here use the latest figures for every month.
What the claimant count does and does not measure
- It is not the unemployment rate. It counts people claiming Jobseeker’s Allowance, plus people on Universal Credit who are required to look for work.
- It includes some people in work on low earnings who must still look for more.
- It is not seasonally adjusted. Comparing October with October is the fairest reading.
- Everything is rounded to the nearest five, so small groups can swing on very little.
- ONS labels the local authority figures official statistics in development, and recent months are often revised.
The figures record who claims, not why. We have not found a Watford source that explains the rise.
What it means for you
If you are claiming, or about to, the help sits with different organisations.
- Universal Credit and JSA are Department for Work and Pensions matters, handled through your work coach at the jobcentre.
- Council tax support is a separate Watford Borough Council scheme that you apply for through the council’s Council Tax Reduction Scheme.
- A shortfall in housing costs can be met by a discretionary housing payment from the borough council, not the DWP.
Sources
- ONS claimant count, dataset NM_162_1, via Nomis, retrieved 17 November 2026. Borough, age, sex, ward, district, county, regional and Great Britain figures for October 2026 and October 2025, and the monthly series from 2019. Not seasonally adjusted.
Have your say