
Women claimants in Watford rose by 70 in a year while men fell by 30, the reverse of Britain. The borough is still Hertfordshire's highest at 4.6%.
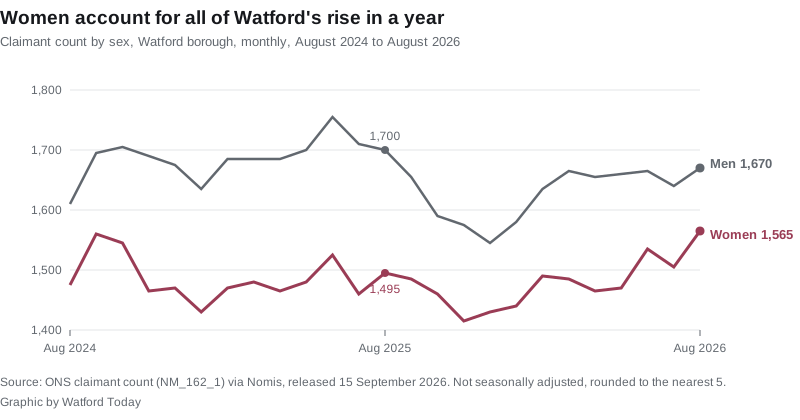
More women are claiming unemployment-related benefits in Watford than at any point in the last two years. The count of women claimants reached 1,565 in August 2026, up 70 on August 2025.
Over the same year the count of men fell by 30, to 1,670. So the whole of the borough’s annual rise, and more, came from women.
That is the reverse of the national picture. Across Great Britain, men’s claims rose 3.3 per cent in a year and women’s rose 1.1 per cent. The figures are from the Office for National Statistics claimant count for August, released through Nomis on 15 September.
The headline figure
- 3,235 people were claiming in Watford in August, 4.6 per cent of residents aged 16 to 64.
- That is up 90 on July and up 40 on August 2025, a rise of 1.3 per cent in a year.
- It is the highest monthly count since June 2025, when it was 3,280.
A rise of 90 between July and August is unusual for Watford. In each of the previous five years the change between those two months was between a fall of 230 and a rise of 35.
The women’s rise is among working-age adults
| Group | August 2025 | August 2026 | Change |
|---|---|---|---|
| Women aged 16 to 24 | 190 | 195 | +5 |
| Women aged 25 to 49 | 970 | 1,005 | +35 |
| Women aged 50 and over | 335 | 365 | +30 |
| Men aged 16 to 24 | 285 | 290 | +5 |
| Men aged 25 to 49 | 1,005 | 955 | -50 |
| Men aged 50 and over | 410 | 425 | +15 |
One line in that table stands out. Women aged 25 to 49 now outnumber men of the same age among Watford claimants, 1,005 to 955. A year ago men led that group by 35.
Nationally that would be very unusual. Across Great Britain there were 934,590 men and 729,700 women claiming in August, so men make up the clear majority.
The figures do not say why. The claimant count records who claims, not the reason. It counts people on Universal Credit who must look for work, and that includes some people in low-paid jobs, so a rise is not the same thing as more people losing work. We have not found a Watford source that explains this one.
Still the highest rate in Hertfordshire
| Area | Claimants | Rate | Change on August 2025 |
|---|---|---|---|
| Watford | 3,235 | 4.6% | +40 (+1.3%) |
| Hertsmere | 2,465 | 3.6% | +90 (+3.8%) |
| Stevenage | 2,125 | 3.6% | +130 (+6.5%) |
| Broxbourne | 2,135 | 3.3% | +30 (+1.4%) |
| Dacorum | 3,190 | 3.2% | +15 (+0.5%) |
| Welwyn Hatfield | 2,530 | 3.2% | +115 (+4.8%) |
| Three Rivers | 1,615 | 2.7% | +45 (+2.9%) |
| North Hertfordshire | 1,990 | 2.4% | +80 (+4.2%) |
| St Albans | 2,235 | 2.4% | +75 (+3.5%) |
| East Hertfordshire | 1,965 | 2.0% | +135 (+7.4%) |
| Hertfordshire | 23,480 | 3.0% | +745 (+3.3%) |
| East of England | 132,125 | 3.3% | +4,595 (+3.6%) |
| Great Britain | 1,664,295 | 3.9% | +37,480 (+2.3%) |
Two things are true at once here.
- Watford’s rate is a full percentage point above the next district. Hertsmere and Stevenage are both on 3.6 per cent.
- Watford’s count grew more slowly than the county’s. Its 1.3 per cent rise over the year is less than half Hertfordshire’s 3.3 per cent. Only Dacorum grew more slowly.
Across the East of England, only three councils have a higher rate than Watford: Luton at 6.6 per cent, Peterborough at 5.4 and Great Yarmouth at 4.8. Harlow is level with Watford on 4.6.
Where in Watford
| Ward | Claimants | Rate |
|---|---|---|
| Holywell | 460 | 6.2% |
| Central | 510 | 5.9% |
| Meriden | 285 | 5.7% |
| Leggatts | 305 | 5.3% |
| Vicarage | 360 | 5.2% |
| Callowland | 300 | 4.6% |
| Woodside | 230 | 4.5% |
| Stanborough | 185 | 4.0% |
| Tudor | 170 | 3.8% |
| Oxhey | 155 | 3.3% |
| Nascot | 140 | 2.4% |
| Park | 130 | 2.4% |
Holywell now has the highest rate in the borough, 6.2 per cent. In the first release of the July figures it was level with Central on 6.0. Central still has the most claimants, 510. Nascot and Park have the lowest rates, both 2.4 per cent. The ward figures add up to 3,230 against a borough total of 3,235, because every figure is rounded to the nearest five.
July’s figure has been revised down
When we reported the July count on 22 August, the first release gave 3,220 claimants and a 4.5 per cent rate. ONS has since revised July to 3,145 and 4.4 per cent. The comparisons in this article use the revised figure. Measured against the July number first published, August would be up 15 rather than 90.
What the claimant count does and does not measure
- It is not the unemployment rate. It counts people claiming Jobseeker’s Allowance, plus people on Universal Credit who are required to look for work.
- It includes some people in work on low earnings who must still look for more.
- It is not seasonally adjusted. Compare August with August for the fairest reading.
- Everything is rounded to the nearest five, so small groups can swing on very little.
- ONS labels the local authority figures official statistics in development, and recent months are often revised, as July was.
What it means for you
If you are claiming, or about to, the help sits with different organisations.
- Universal Credit and JSA are Department for Work and Pensions matters, handled through your work coach at the jobcentre.
- Council tax support is a separate Watford Borough Council scheme that you have to apply for, through the council’s Council Tax Reduction Scheme. Our Watford council tax bands page explains the bands.
- A shortfall in housing costs can be met by a discretionary housing payment from the borough council, not the DWP.
The September figures are due on 20 October.
Sources
- ONS claimant count, dataset NM_162_1, via Nomis, retrieved 16 September 2026. Borough, sex, age, ward, district, regional and Great Britain figures for August 2026, August 2025 and the monthly series from August 2024. Not seasonally adjusted.
- District comparisons cover Hertfordshire’s ten districts; the regional comparison covers local authorities in the East of England.
- Our earlier report, Watford claimant count: 3,220 in July, published 22 August 2026 on the first release of the July figures.
Have your say