

Under-25 claims in Watford rose 1.1% in a year while Hertfordshire's jumped 13%. The borough still has the county's highest claimant rate, at 4.5%.
The number of people aged 16 to 24 claiming unemployment-related benefits in Watford rose by five over the past year, from 465 to 470. That is a rise of 1.1 per cent.
Across Hertfordshire the same figure rose 13.0 per cent. Across Great Britain it rose 9.9 per cent. Watford had the mildest under-25 rise of the county’s ten districts, and it was not close: St Albans rose 23.4 per cent and Broxbourne 22.7 per cent over the same twelve months.
The figures come from the July 2026 claimant count, published by the Office for National Statistics and released through Nomis on 19 August.
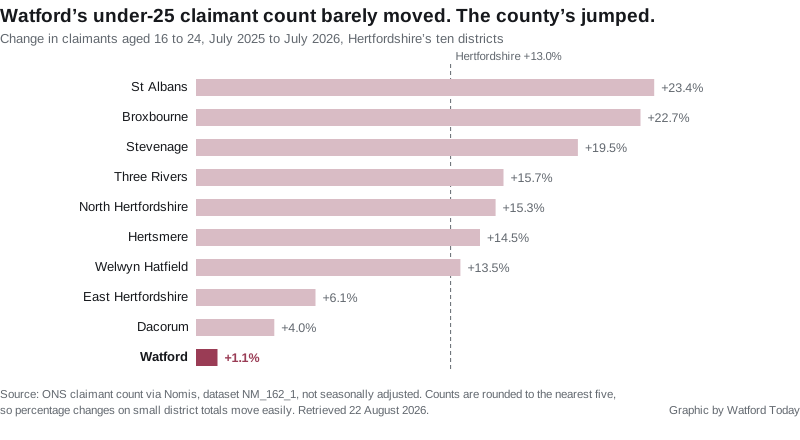
July is the month that always tests this number, because it is the first count after school and college leavers reach the labour market. It is not seasonally adjusted, so the only fair comparison is July with July. On that basis Watford’s youth figure held where it was.
The borough still has the county’s highest rate
None of that makes Watford a low-claimant town. 3,220 people were claiming in July, 4.5 per cent of residents aged 16 to 64. That is the highest rate of Hertfordshire’s ten districts, and it has been for some time.
| Area | Claimants | Rate | Change on July 2025 |
|---|---|---|---|
| Watford | 3,220 | 4.5% | +50 (+1.6%) |
| Hertsmere | 2,450 | 3.6% | +85 (+3.6%) |
| Stevenage | 2,040 | 3.5% | 0 (0.0%) |
| Broxbourne | 2,165 | 3.4% | +80 (+3.8%) |
| Dacorum | 3,190 | 3.2% | -5 (-0.2%) |
| Welwyn Hatfield | 2,560 | 3.2% | +165 (+6.9%) |
| Three Rivers | 1,600 | 2.7% | -20 (-1.2%) |
| North Hertfordshire | 2,005 | 2.4% | +85 (+4.4%) |
| St Albans | 2,225 | 2.4% | +70 (+3.2%) |
| East Hertfordshire | 1,930 | 2.0% | +140 (+7.8%) |
| Hertfordshire | 23,380 | 3.0% | +640 (+2.8%) |
| East of England | 131,670 | 3.3% | +3,670 (+2.9%) |
| Great Britain | 1,657,580 | 3.9% | +25,445 (+1.6%) |
Watford’s rate is a full 0.9 percentage points above the next district, and one and a half times the county average. Widen the frame and the company Watford keeps changes again. Of the 45 local authorities in the East of England, Watford has the fifth highest claimant rate, behind only Luton at 6.5 per cent, Peterborough at 5.4, Great Yarmouth at 4.7 and Harlow at 4.6, and level with Ipswich on 4.5.
Why a flat youth figure is not simply good news
Watford’s under-25 count did not stay low. It got to its current level a year early.
- July 2024: 400
- July 2025: 465, a rise of 16.3 per cent
- July 2026: 470, a rise of 1.1 per cent
The jump the rest of Hertfordshire has just had, Watford had in 2025. What the latest figures show is that the higher level has stuck rather than eased back.
Take the two years together and the gap mostly closes. Watford’s under-25 count is up 17.5 per cent since July 2024, against 19.4 per cent for Hertfordshire and 16.0 per cent for Great Britain. Watford is not an outlier over that longer run. It is a district that moved earlier.
The rise has moved to the over-50s
Where Watford’s total did grow this year, it grew among older workers.
| Age | July 2025 | July 2026 | Change |
|---|---|---|---|
| 16 to 24 | 465 | 470 | +5 (+1.1%) |
| 25 to 49 | 1,965 | 1,980 | +15 (+0.8%) |
| 50 and over | 735 | 765 | +30 (+4.1%) |
The over-50s are now the fastest-growing group of claimants in the borough, and they account for 30 of the 50 extra claimants recorded over the year. The county’s over-50 count also rose, by 5.3 per cent, so this is not unique to Watford. It does reverse the local pattern of the previous year, when 65 of the borough’s 115 extra claimants were under 25.
Where in Watford
The borough figure hides a wide spread. Twelve wards run from 6.0 per cent down to 2.4 per cent, a gap of two and a half times.
| Ward | Claimants | Rate | Aged 16 to 24 | Aged 50+ |
|---|---|---|---|---|
| Central | 515 | 6.0% | 60 | 120 |
| Holywell | 445 | 6.0% | 80 | 95 |
| Meriden | 285 | 5.7% | 50 | 55 |
| Leggatts | 305 | 5.3% | 55 | 75 |
| Vicarage | 360 | 5.1% | 35 | 95 |
| Woodside | 235 | 4.6% | 45 | 50 |
| Callowland | 295 | 4.5% | 40 | 65 |
| Stanborough | 180 | 3.8% | 30 | 45 |
| Tudor | 165 | 3.6% | 15 | 45 |
| Oxhey | 145 | 3.1% | 20 | 45 |
| Park | 145 | 2.7% | 25 | 45 |
| Nascot | 140 | 2.4% | 10 | 35 |
Holywell has the borough’s largest concentration of young claimants, 80 of the 470, which is a sixth of the total from a ward holding about a seventh of the claimant count overall. Nascot, at the other end, has 10.
Central tells the opposite story. It has the most claimants of any ward, 515, but its under-25 share is comparatively small and its over-50 count, 120, is the highest in Watford.
The ward figures add up to 3,215 against a borough total of 3,220. Everything here is rounded to the nearest five, so small gaps like that are expected rather than an error.
What the claimant count does and does not measure
This is the only jobs figure published every month for areas as small as a ward, which is why it is worth following. It is also frequently misread.
- It is not the unemployment rate. It counts people claiming Jobseeker’s Allowance, plus people on Universal Credit who are required to look for work.
- It includes some people who are working. A Universal Credit claimant on low earnings can still be subject to work-search conditions, and is counted here.
- It is not seasonally adjusted. July always carries school and college leavers, so comparing July with June overstates any rise. Compare July with July.
- Everything is rounded to the nearest five. On a ward with 140 claimants, or an under-25 group of 10, a percentage change can move a long way on very little.
One consequence of that last point is worth stating plainly. The county-wide under-25 percentages in the chart above rest on district totals of a few hundred, so they move easily. The direction is consistent across nine of the ten districts, which is what makes Watford’s flat line stand out.
A correction to our own figure. When we reported the June count on 12 August we gave 3,250 claimants and a 4.6 per cent rate, which was the first release. ONS has since revised June down to 3,195 and 4.5 per cent. The revised series still shows the count climbing from a December 2025 low of 2,980, but by 240 rather than the 270 we published.
What it means for you
If you are claiming, or about to, the practical support sits with two different organisations, and neither of them is the borough council’s benefits team.
- Universal Credit and JSA are Department for Work and Pensions matters, handled through your work coach at the jobcentre.
- Council tax support is a Watford Borough Council scheme, separate from Universal Credit, and you have to apply for it. It runs through the council’s Council Tax Reduction Scheme.
- Housing costs are largely inside Universal Credit now, but a discretionary housing payment towards a shortfall comes from the borough council, not the DWP.
If you are 16 to 24 and left education this summer, the figures above suggest something specific about Watford: the local youth market absorbed its jump a year ago and has not worsened since. That is a modest thing to take from a statistic, but it is more than most of the county can say this month.
Sources
- ONS claimant count, dataset NM_162_1, via Nomis, retrieved 22 August 2026. Borough, ward, district, regional and Great Britain figures, all measured for July 2026 against July 2025 and July 2024, not seasonally adjusted.
- Ward figures use the May 2025 ward boundaries. District comparisons cover Hertfordshire’s ten districts; the regional ranking covers the 45 local authorities in the East of England.
- Our earlier report, Watford claimant count: 3,250 in June, published 12 August 2026 on the first release of the June figures.
Watford Today reports from public records and always links to them. The claimant count is published monthly; the August figures are due in September.
Update, 16 September 2026. ONS has revised the July figures since this article was published. The borough count is now 3,145 and 4.4 per cent, down from the 3,220 and 4.5 per cent first released. The revised age split is 455 aged 16 to 24, 1,930 aged 25 to 49 and 755 aged 50 and over. The analysis above reflects the first release. The August figures, and the revised July baseline, are in Watford claimant count: 3,235 in August.
Have your say