
Watford's average home rose 1.4% in August to £408,659, a fifth monthly rise in a row. It is still £1,447 down on a year ago, and flats keep falling.
The average Watford home was worth £408,659 in August, up 1.4% on July. It is the fifth month in a row that prices have risen in the borough, on figures HM Land Registry published this week.
The UK House Price Index for Watford still shows a small fall over the year. The August figure is £1,447 below August 2025’s £410,106, a change of minus 0.4%. In July the gap was minus 1.0%, so it has more than halved in a month.
Five rises in a row
Watford’s average bottomed out at £390,324 in March. Since then it has gone up every month:
| Month | Average price |
|---|---|
| March 2026 | £390,324 |
| April 2026 | £392,669 |
| May 2026 | £394,013 |
| June 2026 | £397,188 |
| July 2026 | £403,169 |
| August 2026 | £408,659 |
That is a rise of £18,335, or 4.7%, in five months.
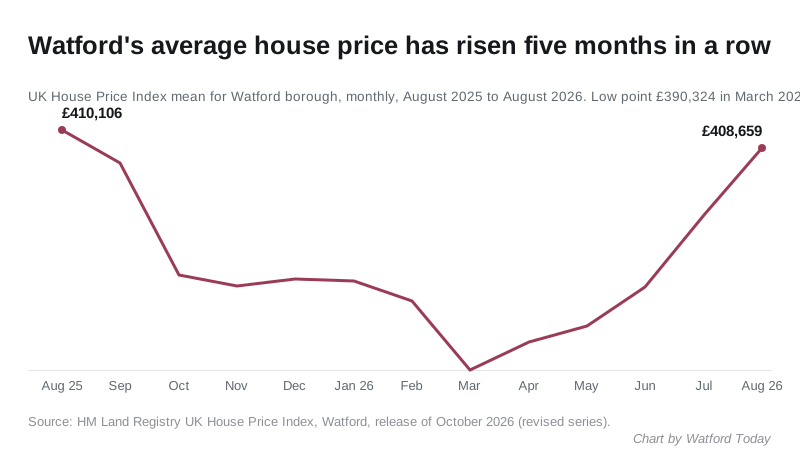
The months the chart covers, from August 2025, were £410,106, £407,445, £398,218, £397,250, £397,869, £397,721 (January 2026), £396,012, then the six months in the table above.
Watford is no longer the county’s only faller
In July, Watford was the only one of Hertfordshire’s ten districts where prices were down on the year. In August that is Stevenage, down 2.1%, with Watford the only other district below zero.
Watford’s 1.4% rise on the month was the joint biggest in the county, level with North Hertfordshire. Five districts fell on the month.
Annual change to August 2026, from the same index:
| District | August 2026 average | Annual change | Change on July |
|---|---|---|---|
| St Albans | £655,974 | +3.2% | +0.7% |
| North Hertfordshire | £422,835 | +3.1% | +1.4% |
| Broxbourne | £414,692 | +2.3% | +0.7% |
| East Hertfordshire | £455,973 | +1.9% | −0.2% |
| Hertsmere | £553,008 | +1.5% | +0.1% |
| Three Rivers | £590,232 | +0.9% | −0.1% |
| Welwyn Hatfield | £446,043 | +0.7% | −0.6% |
| Dacorum | £450,935 | +0.1% | −1.0% |
| Watford | £408,659 | −0.4% | +1.4% |
| Stevenage | £309,123 | −2.1% | −1.7% |
Hertfordshire as a whole averaged £469,651, up 1.4% on the year. England averaged £293,525, up 0.4%.
Houses are up, flats are still down
| Type | August 2026 average | Annual change |
|---|---|---|
| Detached | £941,650 | +0.2% |
| Semi-detached | £541,069 | +1.4% |
| Terraced | £435,927 | +1.0% |
| Flat or maisonette | £265,100 | −2.5% |
Every kind of house is now worth more than a year ago. Flats are the exception, as they have been all year.
The index is set so that January 2023 reads 100. Semis read 101.4 and terraces 101.5, so both are a little above their January 2023 value. Flats read 94.9. The average Watford flat was £279,488 in January 2023, so it is £14,388 cheaper now, a fall of 5.1%.
The borough as a whole reads 98.6. The average home was £414,470 in January 2023, which is £5,811 more than today.
The first-time buyer average was £355,866, down 0.2% on the year. Homes bought with cash averaged £368,431, down 1.8%. Homes bought with a mortgage averaged £416,609, with no change on the year.
Last month’s figures have been revised
Land Registry revises recent months as late sales are registered. When we reported July on 19 September, the index gave Watford £404,299, down 0.7% on the year and up 2.1% on June. The revised July figure is £403,169, down 1.0% on the year and up 1.5% on June. The figures on this page all use the revised series.
Two things to bear in mind
This average is a mean, not a median. Watford’s detached homes average over £940,000, and a few big sales in a month can move the borough figure. Our Watford house prices page gives the median from actual sales, ward by ward.
The monthly sample is small. The latest sales count Land Registry has published for Watford is 70 sales in June 2026, after 54 in May. A month built on numbers that size can jump for reasons that have nothing to do with the market. Five rises in a row is more telling than any single one of them.
What it means for you
If you are selling a house. The run of rises is real, but the borough average is only back to where it was a year ago. Ask your agent for completed prices on your own street, which you can check on the Land Registry’s price paid search.
If you are buying a flat. Flats are the one part of the Watford market that is still getting cheaper. The average is about £14,000 below January 2023.
If you are buying a house. Semis and terraces are slightly above their January 2023 value and rising, so waiting for a fall has not paid off so far this year.
Council tax. Bands are still set on 1991 values, so none of this changes your band. Our Watford council tax bands page has the 2026/27 charges.
The September 2026 figures are due from Land Registry in November.
Sources
Have your say